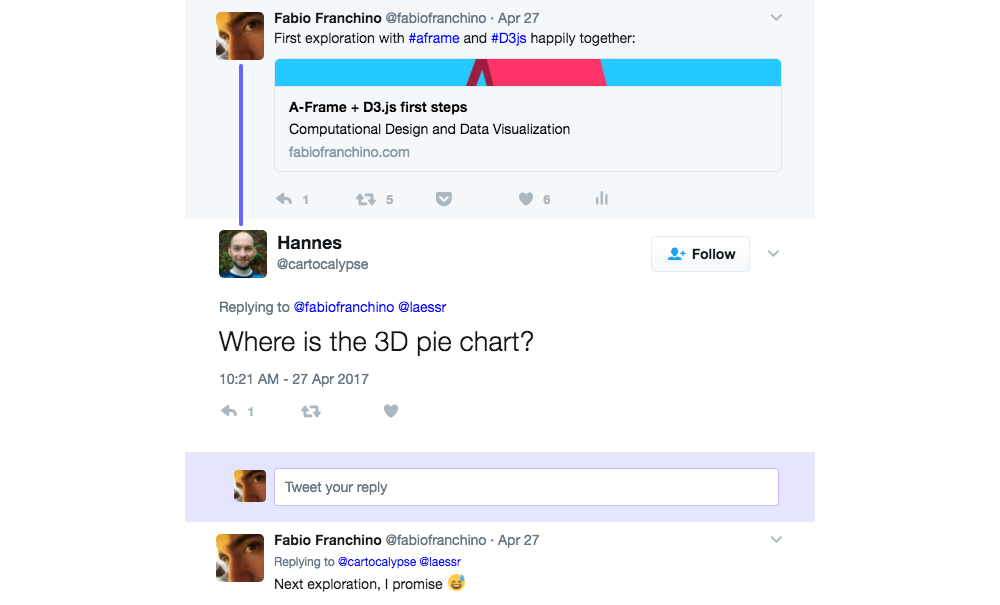
3D pie chart, finally!
A promise is a promise.
I did it. I’ve built the unspeakable, the unmentionable and possibly the worst piece of data visualisation ever invented by the human specie.
May I present my 3D pie chart in all its glory in VR world:
A-Frame makes it ease thanks to the geometry properties of the cylinder. Here the markup to build a single slice:
<a-entity geometry="primitive:cylinder;
            radius:1;
            thetaStart:0;
            thetaLength:90;
            height:1;
            openEnded:false;"
          material="side: double; color:red;"
          rotation="70 20 0" position="0 2 -4"></a-entity>
The key here is the thetaStart and thetaLength allowing to define the start and the end angles of the slice.
Since startAngle and endAngle are properties of the D3.js Pie layout, I can’t help but built the 3D pie using D3.js and some fake data, so here it is ready to be included in your next Powerpoint VR presentation:
Here the relevant portion of the script responsible for the task:
d3.select('a-scene')
    .selectAll('a-entity')
    .data( pie(data) )
    .enter()
    .append('a-entity')
    .attr('geometry', function (d, i) {
      var a = d.startAngle * 180 / Math.PI
      var b = (d.endAngle - d.startAngle) * 180 / Math.PI
      return 'primitive:cylinder;radius:1;thetaStart:' + a + ';thetaLength:' + b + 'height:1;openEnded:false'
    })
    .attr('material', function (d, i) {
      return 'side: double; color:' + colors(i) + ';'
    })
I’m still trying to figure out how to better use this kind of visualization in VR space (joking).
I believe I’ve had enough of pies.
If you’ve had too, join us this summer contributing to this awesome learning experience in Lugano:

As usual, full source code here