
A first Vega-Lite specs dive
Posted on April 18, 2020 in
5 min read
This is a little post about what I've learned on the specs of Vega-Lite after a first dive.
First-off: here my Vega-Lite learning perception:
- It should be dead easy. It's just a JSON file.
- What! I'm struggling a lot even to achieve something very simple.
- Ok, I got it. After dedicating some time, memorizing its grammar, it's going to be great.
If you are a software developer, exploiting Vega-Lite is not immediate. You need to learn a new grammar. You cannot use your programmer super-power. Nevertheless, it's worth the struggle.
The dev setup
I've used the Vega Editor to code the included sample. It's a great way to start with since everything is already packed to support a nice develoment experience. Highly suggested.
Hello world script
A bare-bone Vega-Lite script that compiles looks like:
{
  "$schema": "https://vega.github.io/schema/vega-lite/v4.json",
  "mark":"point"
}
There are some top-level properties to configure the visualization:
{
  "$schema": "https://vega.github.io/schema/vega-lite/v4.json",
  "background": "aliceblue",
  "title": "Some Title",
  "mark":"point",
  "width":200,
  "height":150,
  "view": {"fill":"antiquewhite"},
  "padding":20
}
Adding the data
Dataset can be included inline or by a request. Here an inline simple array:
{
  "data":{
    "values":[2, 5, 8, 6, 22]
  }
}
And here an object in JSON dataset:
{
  "data":{
    "values":[
      {"key1": 20, "key2":100},
      {"key1": 32},
      {"key1": 3}
    ]
  }
}
Inline string can be parsed as well by specifying its format:
{
  "data":{
    "values":"key1,key2\n2,5\n6,8",
    "format": {
      "type": "csv"
    }
  }
}
A dataset can be also generated using sequence:
{
  "data":{
    "sequence": {
       "start": 0,
       "stop": 100,
       "step": 10,
       "as": "key1"
    }
  }
}
There is also a way to set a global dataset in case you need to share it to many views:
{
  "datasets": {
    "mydata": [2, 5, 8, 12]
  },
  "data":{
    "name": "mydata"
  }
}
Here the request way to include a dataset:
"data": {
  "url": "https://fabiofranchino.com/disk/datasets/athletes_sochi.csv",
  "format":{
    "type": "csv"
  }
},
Encoding the properties
Once we have the dataset backed in, we need to define how we want to use its properties in the visualization.
If the dataset is an array of primitives, the datapoint property will be set as datum.data automatically, otherwise will follow the dataset structure.
There are many properties that can be used, though, x and y are the most common one:
{
  "$schema": "https://vega.github.io/schema/vega-lite/v4.json",
  "mark":"point",
  "data":{
    "values":[3, 6, 2, 67]
  },
  "encoding": {
    "x": {"field":"data", "type": "quantitative"}
  }
}
Quantitative for numbers, Nominal for categories:
{
  "encoding": {
    "y": {
      "field":"k1",
      "type": "nominal"
    },
    "x": {
      "field":"k2",
      "type": "quantitative"}
  }
}
We can color all marks:
{
  "mark":{
    "type": "circle", "color":"red"
  }
}
or coloring them using a data property:
{
  "encoding": {
    "x": {
      "field":"data",
      "type": "quantitative"
    },
    "color": {
      "field": "data"
    }
  }
}
Data transformation
Vega-Lite follows the same principles of D3.js, that is:
The data structure should be close with the visualization structure as much as possible.
That means, if we want to create a specific visualization structure, it's better to re-structure our incoming dataset first.
Vega-Lite comes with a lot of data-transformers, I'm listing the most commons.
If we want to show only a portion of the data points, we can filter in/out data points:
{
  "transform": [
    {
      "filter": "datum.data < 10"
    }
  ],
}
If we need a new, computed, property within the data points, we can define and calculate it:
{
  "transform": [
    {
      "calculate": "datum.data + 100", "as": "newprop"
    }
  ],
}
If we need to aggregate and group by a specific property, like a pivot table, here the way:
"transform": [{
  "aggregate": [{
    "op": "count",
    "field": "name",
    "as": "athletes"
  }],
  "groupby": ["country"]
}
Transformations can be concatenated in order to reach the desired result:
"transform": [
  {
    "aggregate": [{
      "op": "count",
      "field": "name",
      "as": "athletes"
    }],
    "groupby": ["country"]
  },
  {
    "filter": "datum.athletes > 100"
  }
]
Real-world chart
The following is the first Vega-Lite script I've created using a real dataset, trying to answer the question: Which are the top countries with the most number of athletes?
The relevant details are:
- I've transformed the dataset using an aggregate function
- Then, I filtered it according to the newly create property
athletes
{
  "$schema": "https://vega.github.io/schema/vega-lite/v4.json",
  "width": 400,
  "data": {
    "url": "https://fabiofranchino.com/disk/datasets/athletes_sochi.csv",
    "format":{
       "type": "csv"
    }
  },
  "transform": [{
    "aggregate": [{
      "op": "count",
      "field": "name",
      "as": "athletes"
    }],
     "groupby": ["country"]
  },
  {
     "filter": "datum.athletes > 100"
  }],
  "mark": "bar",
   "encoding": {
     "x":{
       "type":"nominal", "field": "country", "sort":"-y"
     },
     "y":{
        "type":"quantitative", "field": "athletes"
     }
   }
}
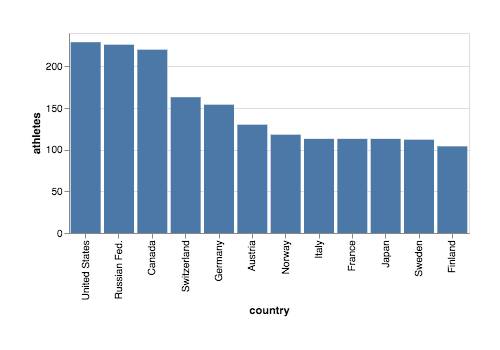
One of the thing I wanted to do (without success) was to filter the array according to the index position of the data point in order to filter based on the amount of countries instead the amount of athletes, this way I can answer the question: Which are the top 10 countries with the most number of athletes?
I'll try to answer it in next episode.
In this little journey I constantly used the following resources: